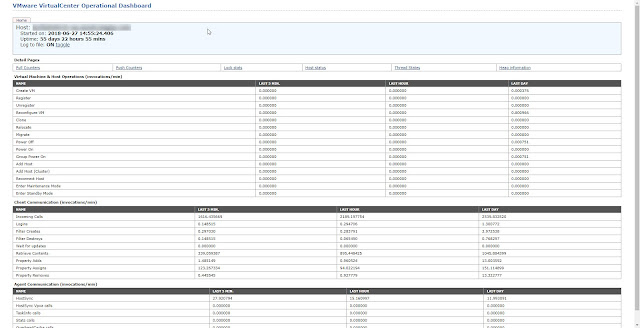
Browse to the following URL and replace the vCenter name. This needs authentication.
https://vCENTER_SERVER_FQDN/vod/index.html
On the Home page, you can get detailed stats about -
- vCenter Uptime
- Virtual Machine & Host Operations (invocations/min)
- Client Communication
- Agent Communication
There are 6 detail pages available.
Example - If you click on "Host Status" you will get detailed info about Hostname, IPs, MOID, Last heartbeat time etc.

No comments:
Post a Comment